
Platform
11 field-validated survey protocols across three marine ecosystems
Standardized data collection for coral reefs, seagrass meadows, and mangrove forests. Every protocol includes built-in quality checks, GPS tagging, media capture, and automated data validation.
Overview
Protocols built for real field conditions
Marine monitoring programs need repeatable, scientifically sound survey methods that work across teams, seasons, and sites. MariMap provides 11 protocols designed by marine scientists for conditions you actually encounter in the field: limited visibility, boat-based operations, remote locations without connectivity, and teams with varying levels of experience.
Each protocol captures the data fields required by major monitoring frameworks, including GCRMN, Reef Check, and national MPA reporting standards. Data validation rules run during collection, catching common errors like depth values outside expected ranges or substrate categories that do not match the protocol type.
All protocols share a common data architecture. This means you can query across survey types, compare sites that use different methods, and export unified datasets for analysis. GPS coordinates, timestamps, surveyor identity, and environmental conditions are recorded automatically with every observation.
Coral reef protocols
Benthic Point Intercept Transect (PIT)
Record substrate composition at fixed intervals along a transect line. PIT surveys produce percentage cover estimates for hard coral, soft coral, algae, rubble, sand, and other benthic categories. The protocol supports customizable interval spacing (typically 25 cm or 50 cm) and integrates with standard reef monitoring frameworks.
Benthic Line Intercept Transect (LIT)
Measure continuous substrate boundaries along a transect tape. LIT provides higher-resolution cover data than point intercept by recording the exact start and end position of each substrate type. Particularly useful for detecting small colonies and tracking recovery in restoration areas where precise cover measurements matter.
Fish Belt Transect
Count and estimate sizes of fish species within a defined belt width along a transect. The protocol supports multiple belt widths for different size classes, following established methods for separating large roving species from small territorial fish. Species are validated against the WoRMS taxonomic backbone during data entry.
Invertebrate Belt Transect
Survey invertebrate populations along belt transects with species-specific detection protocols. Covers key indicator species such as Diadema sea urchins, giant clams, crown-of-thorns starfish, and commercially important species like sea cucumbers and lobsters. Abundance and size data support population trend analysis.
Bleaching Assessment
Document coral bleaching severity across colonies using standardized color reference charts. The protocol records bleaching extent (percentage of colony affected), severity category, and species-level identification. Repeat assessments track recovery trajectories and help distinguish between mild seasonal bleaching and mass bleaching events.
Habitat Complexity (Rugosity)
Quantify three-dimensional reef structure using chain-and-tape rugosity measurements or visual complexity scores. Habitat complexity is a strong predictor of fish diversity and abundance. The protocol captures rugosity index values that can be compared across sites and tracked over time to detect structural degradation.
Benthic Photo Quadrat
Capture georeferenced photographs of fixed quadrat positions for detailed substrate analysis. Photos are tagged with depth, GPS coordinates, and quadrat identifiers. The protocol supports both field-based visual scoring and lab-based analysis from high-resolution images, with annotation tools for identifying coral genera and other benthic organisms.
eDNA Sample Metadata
Record collection metadata for environmental DNA water samples, including sample volume, filtration method, preservation technique, and storage conditions. The protocol ensures that eDNA samples carry the contextual information needed for reliable species detection analysis. Sample locations are GPS-tagged and linked to concurrent survey data.
Seagrass protocols
Seagrass Quadrat Survey
Measure seagrass cover, canopy height, and species composition within quadrat frames. The protocol captures shoot density estimates and percentage cover by species. Designed for both intertidal and subtidal seagrass meadows, with depth-stratified sampling guidance.
Mangrove protocols
Mangrove Tree Growth (DBH)
Measure diameter at breast height and tree height for individual mangrove trees within permanent plots. The protocol supports multiple species identification, tracks growth rates over time, and calculates above-ground biomass estimates using species-specific allometric equations. GPS-tagged individual trees enable repeated measurements of the same specimens across survey periods.
Fauna Observation
Records the diversity and abundance of fauna species within defined plots to assess ecosystem health and detect changes over time.
Cross-ecosystem protocols
Fauna Observation
Record opportunistic wildlife observations during any field activity. The protocol captures species identification, count, behavior, life stage, and location for marine mammals, sea turtles, seabirds, and other notable fauna. Observations are timestamped and georeferenced, contributing to long-term species occurrence databases and supporting OBIS data submissions.
Methods
Eleven survey protocols, one platform.
Six flagship protocols are shown below. The platform supports eleven in total. Every protocol is defined with the method it runs on, the data it captures, and the field conditions it is designed for. Teams mix and match across ecosystems.
Benthic Transect
Point intercept or photo quadrat transects to quantify benthic cover.
Fish Belt Transect
Belt transect counts of fish by size class and taxon.
Seagrass Quadrat
Quadrat-based seagrass cover, density, and morphology measurements.
Tree Growth
Collects DBH, height, and crown width to estimate growth and carbon sequestration.
Bleaching Assessment
Colony-level bleaching severity, extent, and mortality assessment.
eDNA
Environmental DNA water sampling and species detection via metabarcoding.
How protocols work in the field
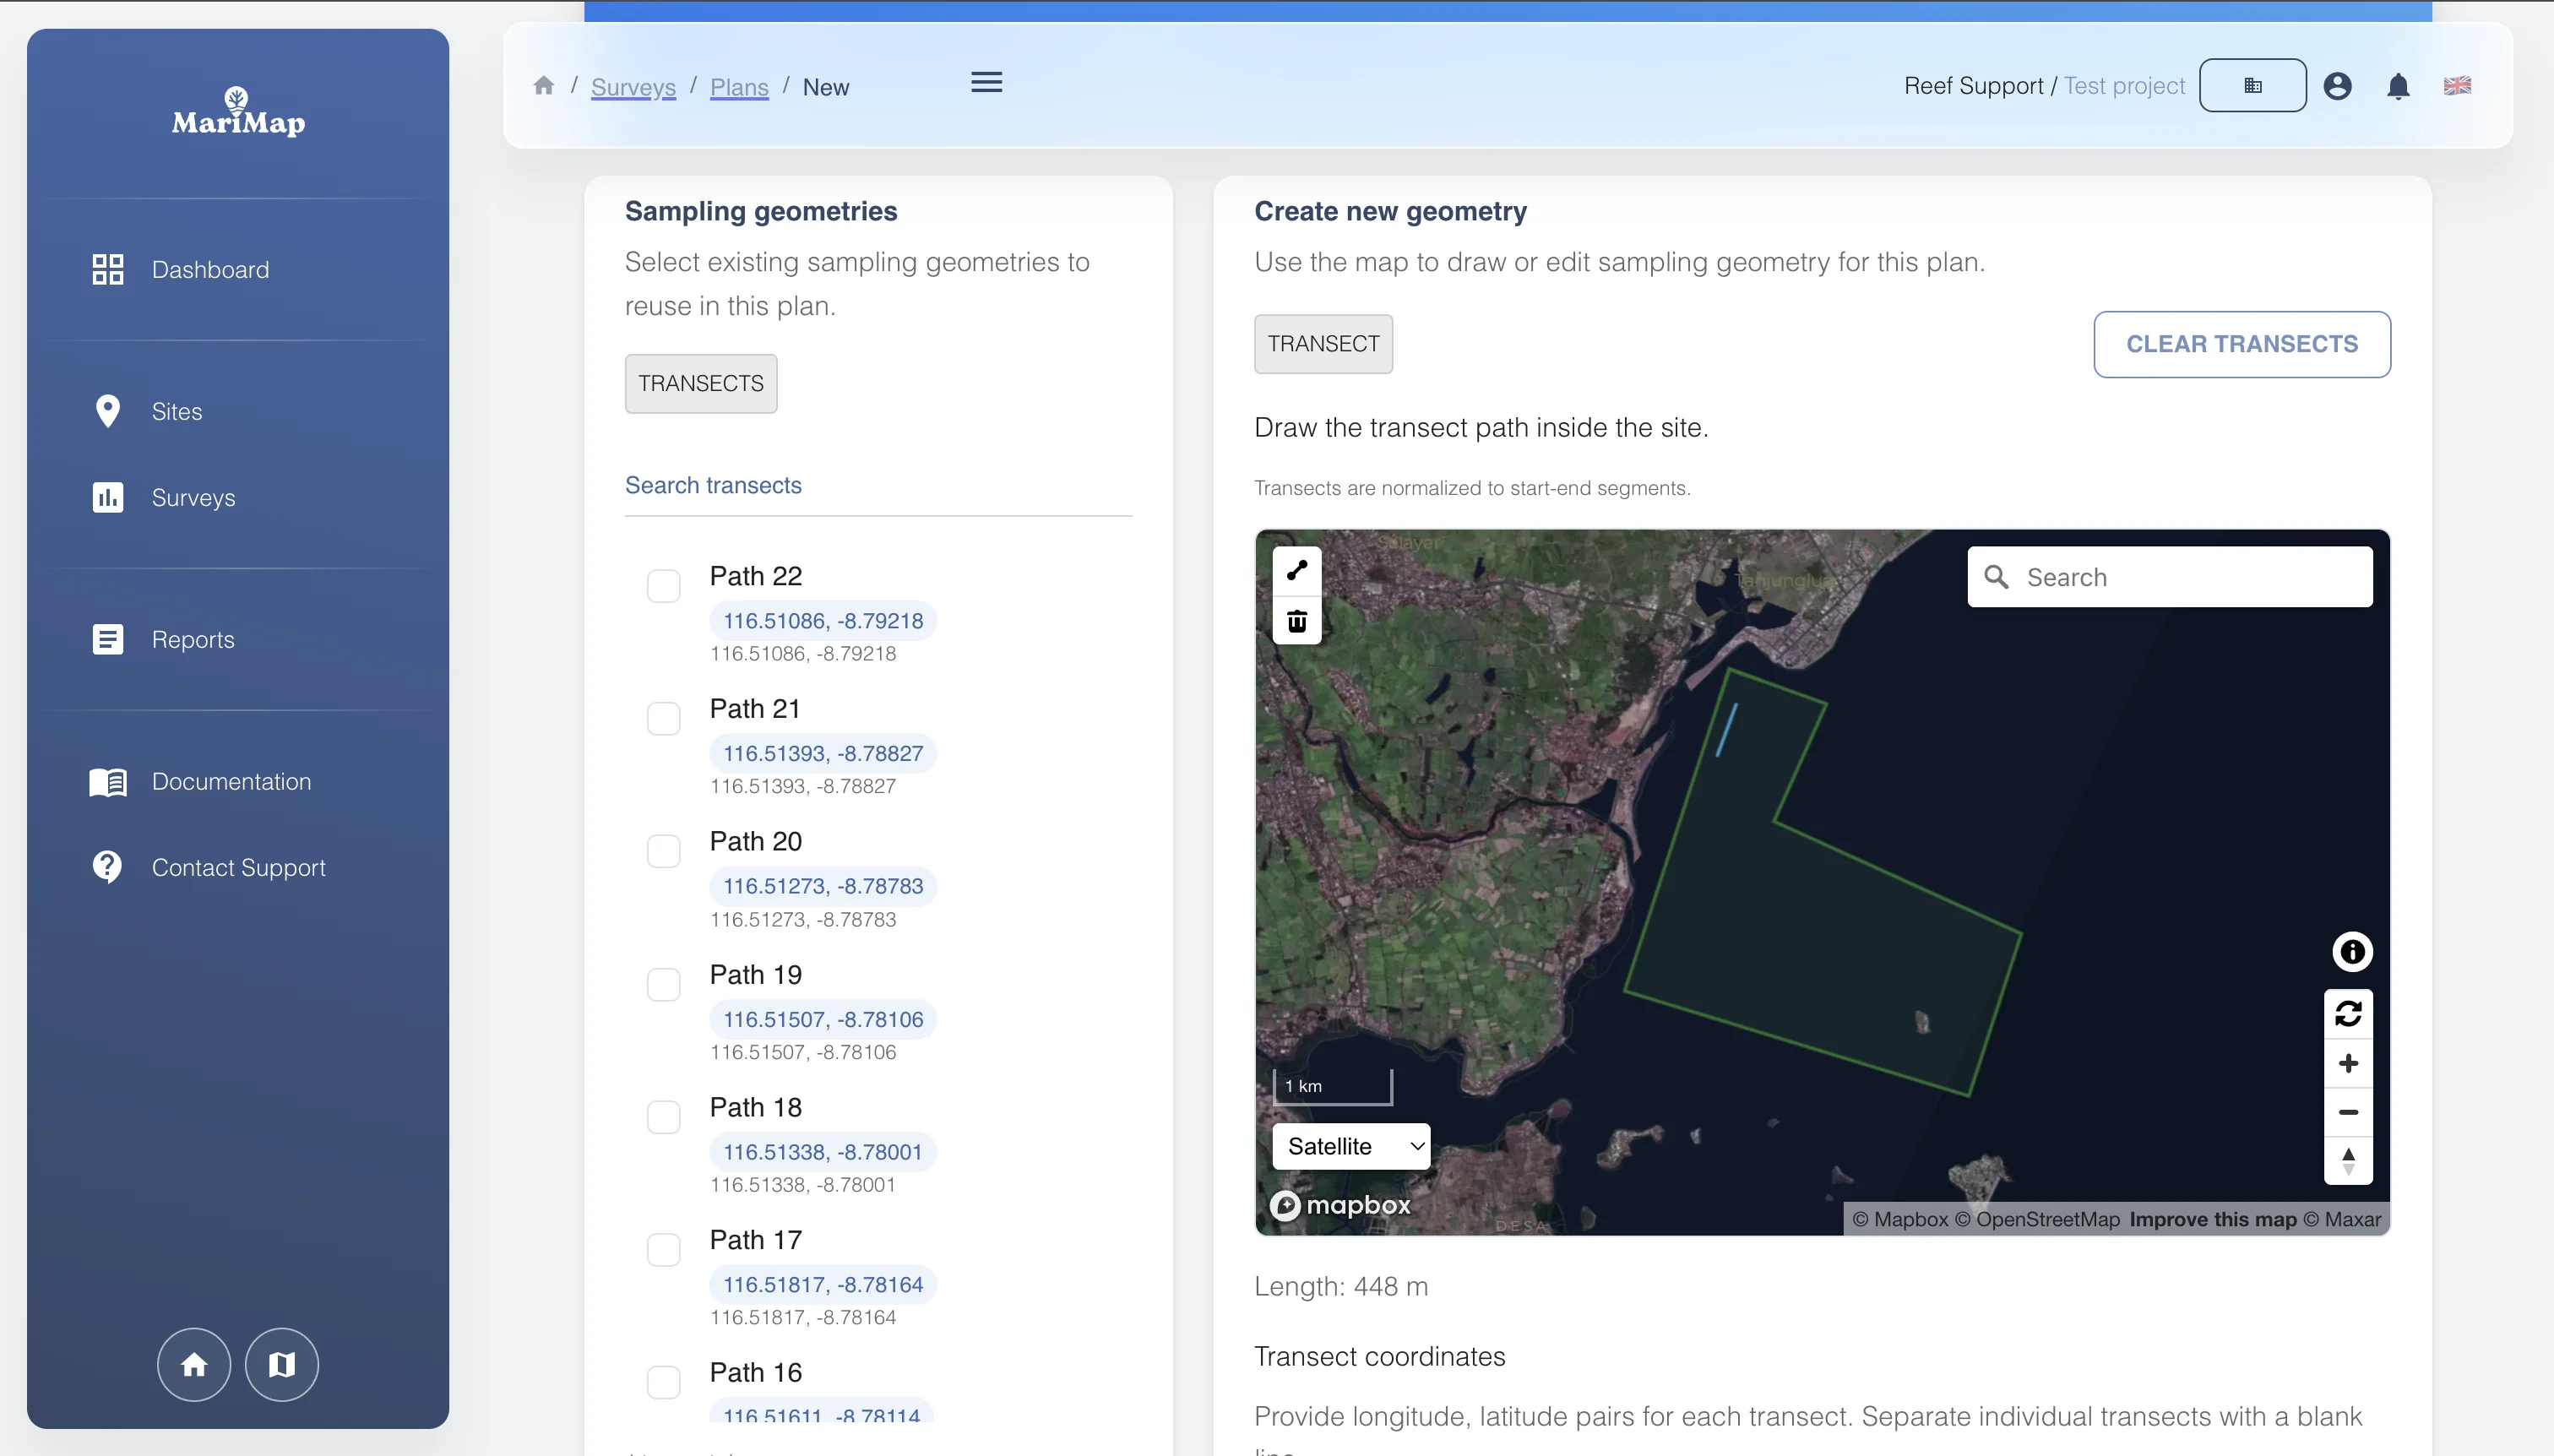
Design your monitoring plan
Define survey sites, select protocols, set sampling schedules, and assign teams. MariMap generates survey plans with spatial boundaries, depth ranges, and protocol-specific parameters. Plans sync to field devices before departure.
Collect data in the field
Field teams open assigned survey plans in MariField and collect data following protocol-specific screens. GPS coordinates, depth, time, and environmental conditions record automatically. Data validation runs in real time, flagging entries that fall outside expected ranges. Everything works offline.
Review, analyze, and report
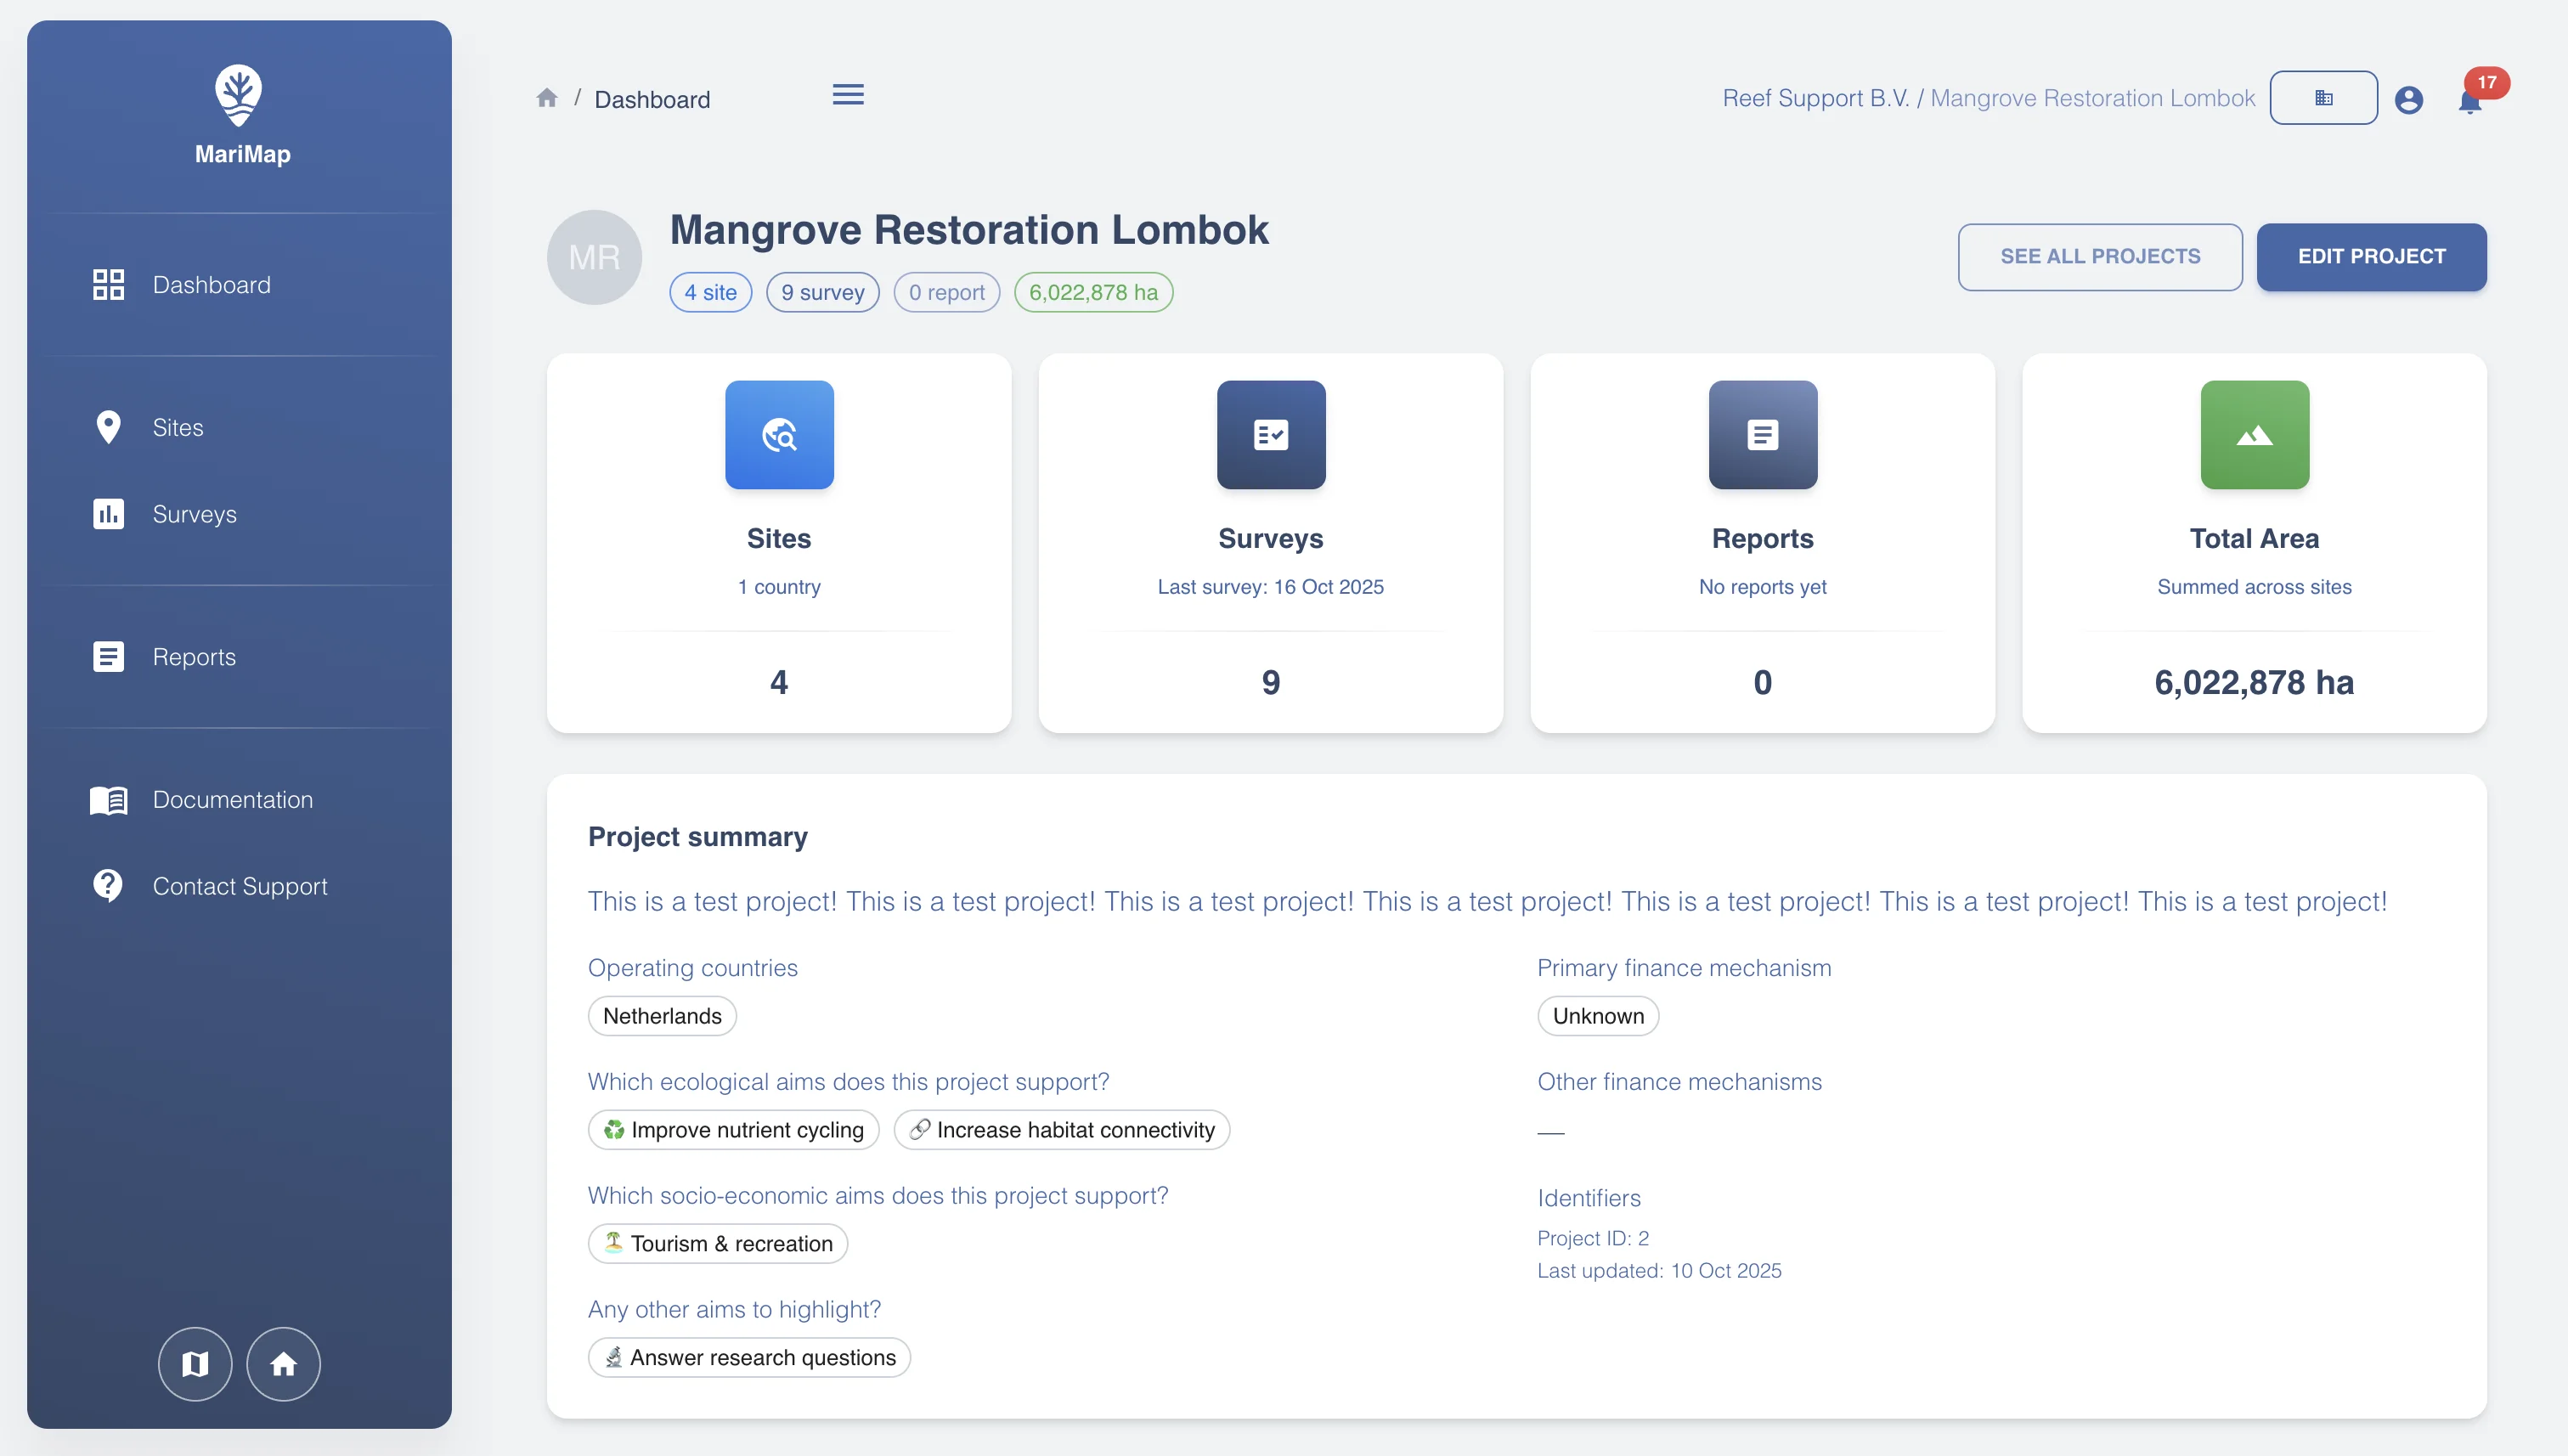
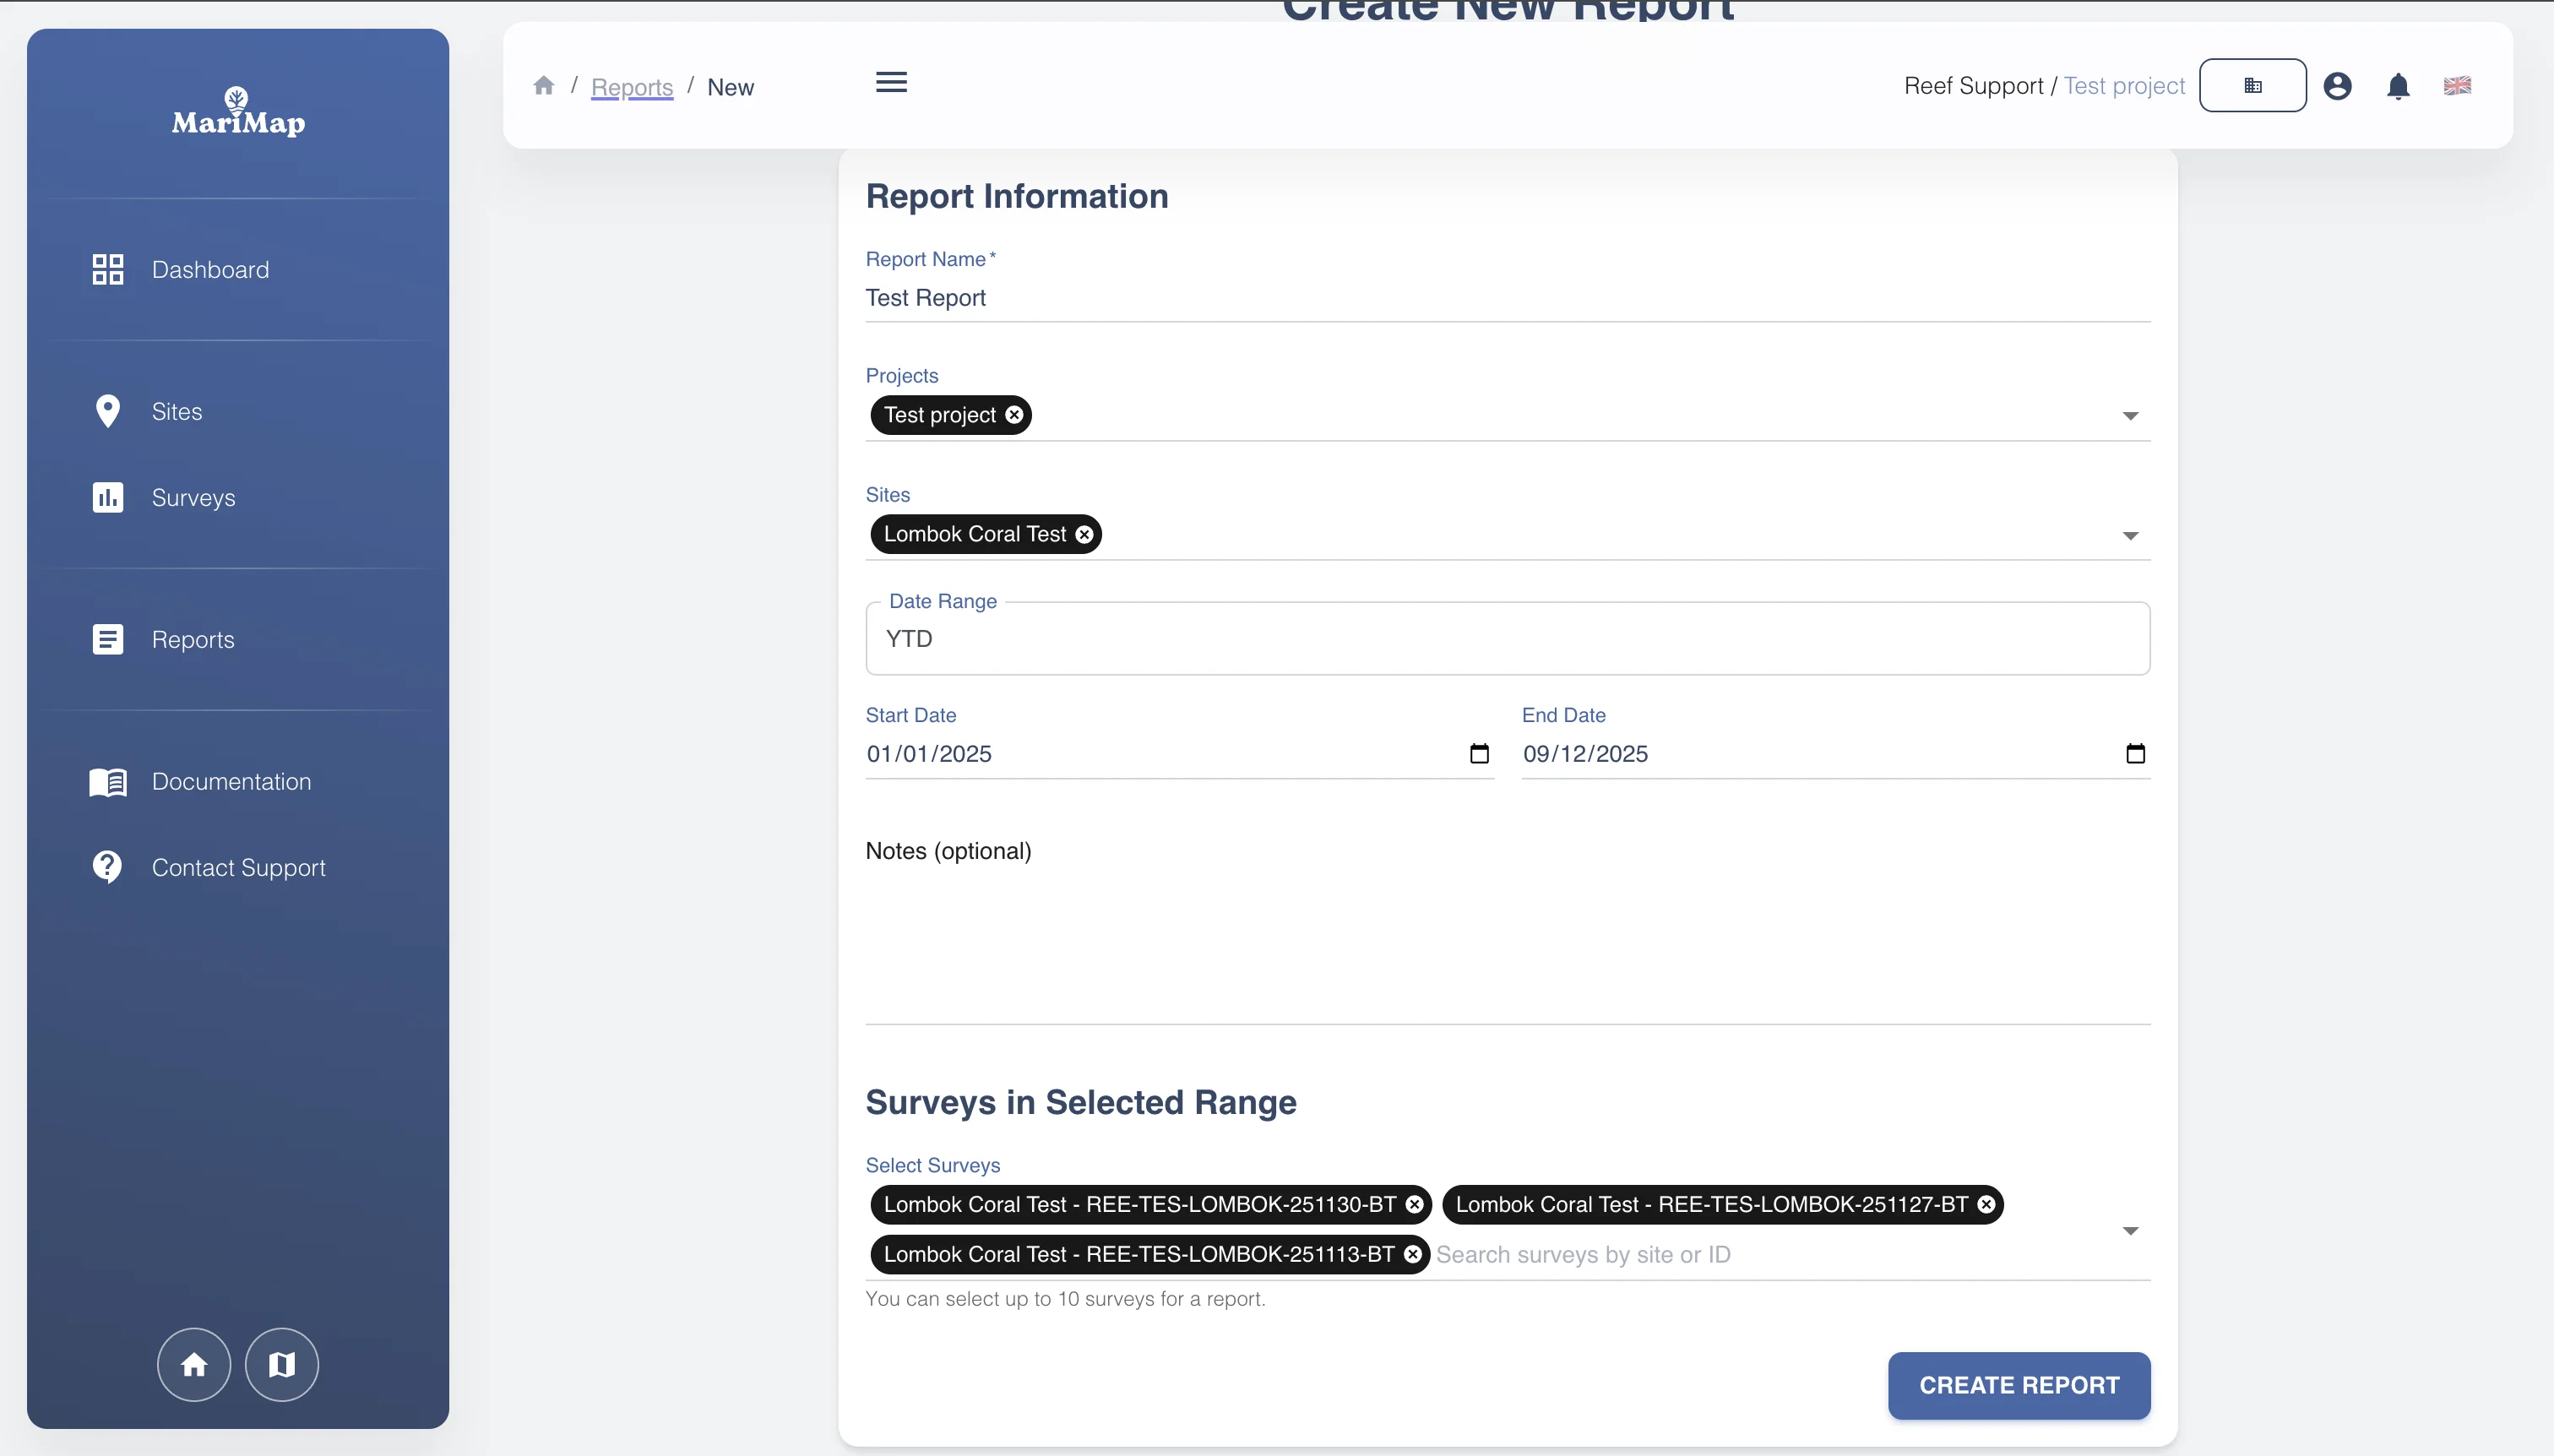
Completed surveys sync to MariMap where project managers review data quality, run indicator calculations, and generate reports. Dashboards show survey coverage maps, indicator time series, and site comparison charts. Export in CSV, GeoJSON, PDF, or Darwin Core Archive formats.
Ready to put MariMap to work?
Talk to our team about your monitoring programme, or start exploring the platform right away.