
MariMap
MariMap Guides
Learn how to set up projects, plan surveys, track baselines, and produce MRV-ready reports with MariMap.
Featured guides
Start with the featured guide, then explore the site-specific and workflow guides below.
Getting Started with MariMap
platform guides
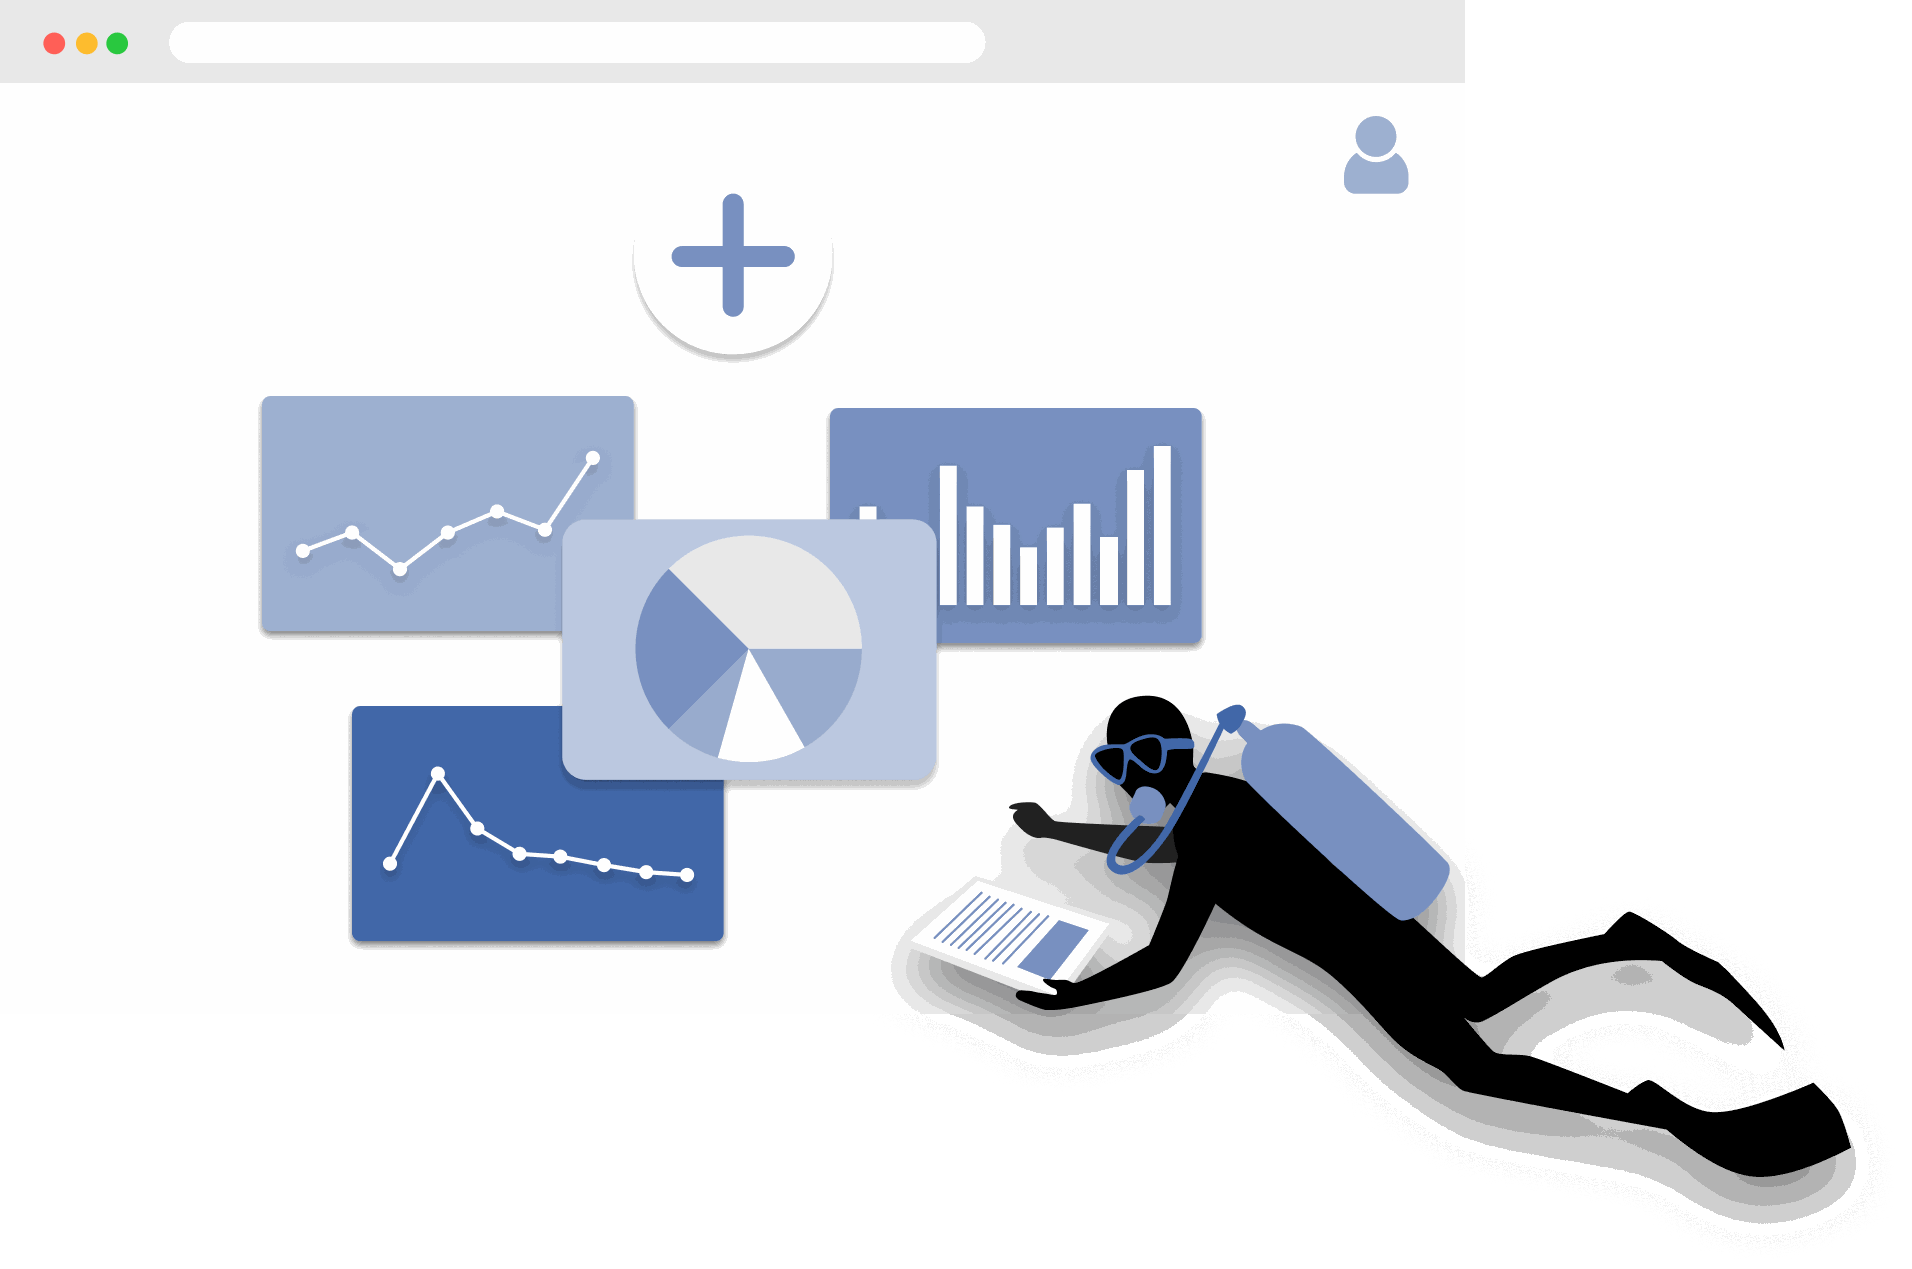
MariMap is a marine conservation platform that connects projects, sites, surveys, and reporting in one workspace. Start by selecting your organization, creating a project, and adding a site boundary so the map, surveys, and analytics all point to real places. From there you can plan surveys, collect field observations, and review environmental context in Analytics. This guide walks through the first steps in the marine monitoring software so your team can work consistently from day one.
The Complete Guide to Marine Restoration Monitoring
reference guides
Marine restoration monitoring tracks whether restoration interventions are producing measurable ecological outcomes. Key metrics include fragment survival rate, growth rate, coral cover expansion, genetic diversity, and cost-effectiveness. Effective monitoring programs combine field survey methods (transects, quadrats, fragment tracking) with environmental context from satellite data and standardized reporting. This guide covers the full monitoring workflow from metric selection through evidence packaging for funder reporting and additionality claims.
Open Data Sources for Marine Conservation: A Practical Guide
reference guides
Marine conservation projects can access a wide range of open data sources to complement field surveys with environmental context, species records, and spatial analysis. Key integrated sources in MariMap include CMEMS for ocean conditions, NOAA Coral Reef Watch for thermal stress, CLMS for land monitoring, GHSL for population data, Allen Coral Atlas for reef mapping, and WoRMS for taxonomy. OBIS and GBIF serve as export targets via Darwin Core Archive (DwC-A). This guide covers what each source provides, how to access it, and how to combine multiple sources for site-level analysis.
Seagrass Monitoring: Methods, Metrics, and Best Practices
ecosystem guides
Seagrass meadows are critical marine ecosystems that provide carbon sequestration, fisheries habitat, and coastal protection. Monitoring seagrass requires repeatable methods that capture cover, shoot density, canopy height, species composition, and sediment carbon. This comprehensive guide covers the full range of monitoring methodologies (quadrat, transect, remote sensing), key metrics for health and blue carbon assessment, common challenges like turbidity and seasonal variation, and best practices from the scientific literature.
Blue Carbon Field MRV: What Data Do You Actually Need?
reference guides
Blue carbon MRV (Monitoring, Reporting, and Verification) requires specific field data to quantify carbon stocks and stock changes in mangrove, seagrass, and salt marsh ecosystems. The required data depends on the ecosystem type and the carbon credit methodology being followed (VM0033, Plan Vivo, Gold Standard). Core requirements include above-ground biomass measurement, below-ground biomass estimation, soil carbon core sampling, and satellite-derived extent mapping. This guide explains what field data is needed for each ecosystem, how to align with major methodologies, and common failures to avoid.
Coral Reef Monitoring: Methods, Metrics, and Best Practices
ecosystem guides
Coral reef monitoring combines standardized field methods (PIT, LIT, fish belt transect, bleaching assessment, photo quadrat) with environmental data to track reef health over time. Key metrics include coral cover, species richness, fish biomass, rugosity, and bleaching prevalence. This comprehensive guide covers methodology selection, metric interpretation, monitoring program design, common challenges, and best practices drawn from GCRMN, Reef Check, and AGRRA protocols.
Mangrove Monitoring: Methods, Metrics, and Best Practices
ecosystem guides
Mangrove monitoring combines plot-based field surveys (DBH measurement, canopy assessment, soil coring) with remote sensing to track forest condition, carbon stocks, and ecosystem services. Key metrics include tree density, basal area, above-ground biomass, soil carbon, and canopy cover change. This comprehensive guide covers monitoring methodologies, metric interpretation, blue carbon assessment, program design, common challenges, and best practices from Kauffman and Donato protocols and CIFOR methods.
Ecosystem Guides
Coral Reef Monitoring in MariMap
ecosystem guides
MariMap supports coral reef monitoring with benthic transects, fish transects, and benthic image surveys. These coral survey methods help teams track reef condition, coral cover, and fish community trends over time. This guide explains how to select the right protocol, configure method parameters, and enter coral reef monitoring data in MariMap. It also shows how to connect surveys with heat stress context from satellite data.
Seagrass Monitoring in MariMap
ecosystem guides
MariMap supports seagrass monitoring using benthic transects, fish transects, and benthic image surveys configured for seagrass sites. These seagrass survey methods help teams track seagrass cover, habitat composition, and associated fauna over time. This guide shows how to set up seagrass monitoring plans, enter data, and keep monitoring consistent across seasons.
Mangrove Monitoring in MariMap
ecosystem guides
MariMap supports mangrove monitoring with tree growth surveys and fauna observation surveys. Use tree growth surveys to capture DBH, height, health, and species across plots, and use fauna observations to record associated wildlife in mangrove sites. This guide walks through setting up mangrove monitoring plans, entering data, and keeping protocols consistent across teams.
Protocol Guides
Benthic Transect Methods: PIT and LIT in MariMap
protocol guides
MariMap supports two standard benthic transect methods for coral reef monitoring: Point Intercept Transect (PIT) and Line Intercept Transect (LIT). Both methods measure benthic cover and substrate composition along fixed transect lines, but they differ in how observations are recorded. PIT records the substrate at fixed intervals along the transect, while LIT measures the continuous length of each substrate category. This guide explains how to configure both methods in MariMap, collect data in MariField, and interpret benthic cover results.
Fish Belt Transect Surveys in MariMap
protocol guides
Fish belt transect surveys in MariMap capture fish abundance, size classes, biomass estimates, and trophic group composition along defined belt transects. The method complements benthic cover data by revealing how fish communities respond to reef condition changes. This guide covers setting up belt transect geometry, recording fish observations in MariField, understanding biomass calculations, and reviewing fish community trends in the MariMap dashboard.
Seagrass Quadrat Survey Methods in MariMap
protocol guides
Seagrass quadrat surveys in MariMap measure cover, shoot density, canopy height, species composition, and sediment characteristics within standardized sampling frames. The method supports measurement scales for different levels of detail, from rapid assessments to comprehensive blue carbon monitoring. This guide explains how to configure quadrat geometry, record observations in MariField, assess sediment type, and connect seagrass data to blue carbon estimation.
Platform Guides
Setting Up Your First Project and Site
platform guides
Projects in MariMap organize your marine conservation work, while sites define the exact locations where surveys happen. This guide shows how to create a project with the right focus and privacy settings, then add a site with accurate boundaries or coordinates. You will see the exact wizard steps used in MariMap so your team stays organized from day one and your marine conservation project management stays consistent across sites.
Planning Surveys and Data Collection
platform guides
Survey planning in MariMap keeps marine data collection consistent across teams and sites. Use survey plans to define protocols, sampling geometry, and recurrence schedules before field work starts. Then create surveys from those plans so your data grids, methods, and units are ready in advance. This guide walks through the planning workflow used in MariMap today.
Understanding Satellite and Environmental Data in MariMap
platform guides
MariMap provides satellite and environmental data from NOAA Coral Reef Watch and Copernicus Marine Service, including sea surface temperature, salinity, chlorophyll, pH, currents, and heat stress indicators. This guide explains what data is available, how to interpret charts and condition categories, and how to use the environmental context to inform marine conservation decisions. All data sources are cited and linked to the MariMap references page.
Generating Reports for Funders and Regulators
platform guides
MariMap's report builder helps you compile selected surveys, notes, and data into professional reports for funders, regulators, or partners. Choose projects and sites, filter by survey status and date range, and review the report preview before sharing. This guide explains how to create reports, track progress, and keep reporting consistent across monitoring cycles.
Managing Teams and Permissions
platform guides
MariMap supports multi-organization projects with clear team roles and permissions. Use the Organization settings to invite team members, assign Admin or Member roles, and manage access to marine data. This guide walks through the team workflow in MariMap so collaboration stays secure, organized, and audit-ready.
Data Export Formats in MariMap
platform guides
MariMap supports six data export formats: Darwin Core Archive (DwC-A), GCRMN, GeoJSON, CSV, PDF, and Excel. Each format serves different audiences and use cases, from publishing biodiversity records to GBIF to sharing formatted reports with funders. This guide explains what each format contains, when to use it, how to export from the report builder, and how to choose the right format for your audience.
Offline Field Surveys with MariField
platform guides
MariField is designed for offline-first data collection in remote marine environments. Survey protocols, species lists, and site data sync to the mobile device before fieldwork, and all observations are stored locally during data collection. When connectivity returns, MariField syncs collected data back to MariMap with validation and conflict resolution. This guide covers preparation, underwater data collection, GPS and depth metadata, photo capture, sync behavior, and tips for remote field deployments.
Compliance & Reporting
TNFD & CSRD Reporting Workflow
compliance reporting
Use MariMap evidence to support Taskforce on Nature-related Financial Disclosures (TNFD), Corporate Sustainability Reporting Directive (CSRD), European Sustainability Reporting Standards (ESRS), and EU Taxonomy reporting. This guide outlines a practical workflow from baselines to disclosure-ready exports.
Reference Guides
Coral Restoration Workflows in MariMap
reference guides
MariMap supports coral restoration workflows for nurseries and labs by tracking structures, genotypes, fragments, and outplant batches. Restoration facilities are set up as Facility sites, and the Restoration workspace lets teams log growth, health, and outplant readiness in one place. This guide shows how to configure a restoration facility, manage fragments, and track outplanting outcomes in MariMap.