
Platform
From nursery to outplant to long-term survival
MariMap tracks the entire coral restoration lifecycle. Manage nurseries, record donor colonies and genotypes, monitor fragment growth, plan outplant sites, and measure survival rates with Kaplan-Meier curves.
Overview
The full restoration lifecycle in one system
Coral restoration programs generate large volumes of data across nurseries, outplant sites, and monitoring visits. Fragment inventories, growth measurements, survival counts, genotype records, and cost tracking often live in separate spreadsheets managed by different team members. As programs scale to thousands of fragments across multiple sites, maintaining data integrity becomes a significant challenge.
MariMap provides a structured data model that connects every stage of the restoration pipeline. A fragment record links back to its donor colony, carries its genotype identifier, tracks its nursery history, records where and when it was outplanted, and accumulates survival and growth measurements over time. This connected data structure enables analysis that spreadsheets cannot support.
Survival analysis uses Kaplan-Meier estimators to calculate survival curves that account for censored observations and irregular monitoring intervals. Growth metrics track changes in tissue area, branch length, or colony diameter. Cost data attaches to activities, enabling per-fragment and per-site efficiency calculations that help programs optimize their methods.
The restoration pipeline
Plan
Define restoration sites, set target species and density goals, and create outplant plans with spatial boundaries. Planning tools help identify suitable substrate, optimal depth ranges, and proximity to existing reef structure.
Nursery
Register nursery structures (trees, frames, ropes, tables) and track fragment inventories. Record attachment dates, source colonies, and initial measurements. Monitor nursery health with scheduled assessments.
Genetics
Maintain genotype registries linking fragments to donor colonies. Track genetic diversity across nurseries and outplant sites to ensure restoration populations maintain adequate genetic variation for long-term resilience.
Monitor
Conduct regular monitoring visits to record fragment survival, growth measurements, and health status. Automated survival analysis generates Kaplan-Meier curves and identifies trends across cohorts, species, and sites.
Outplant
Plan and execute outplanting operations with GPS-tagged placement locations. Record substrate type, attachment method, depth, and initial condition. Post-outplant monitoring tracks establishment success and early mortality.
Feature deep dives
Tools built for restoration practitioners
Nursery and fragment management
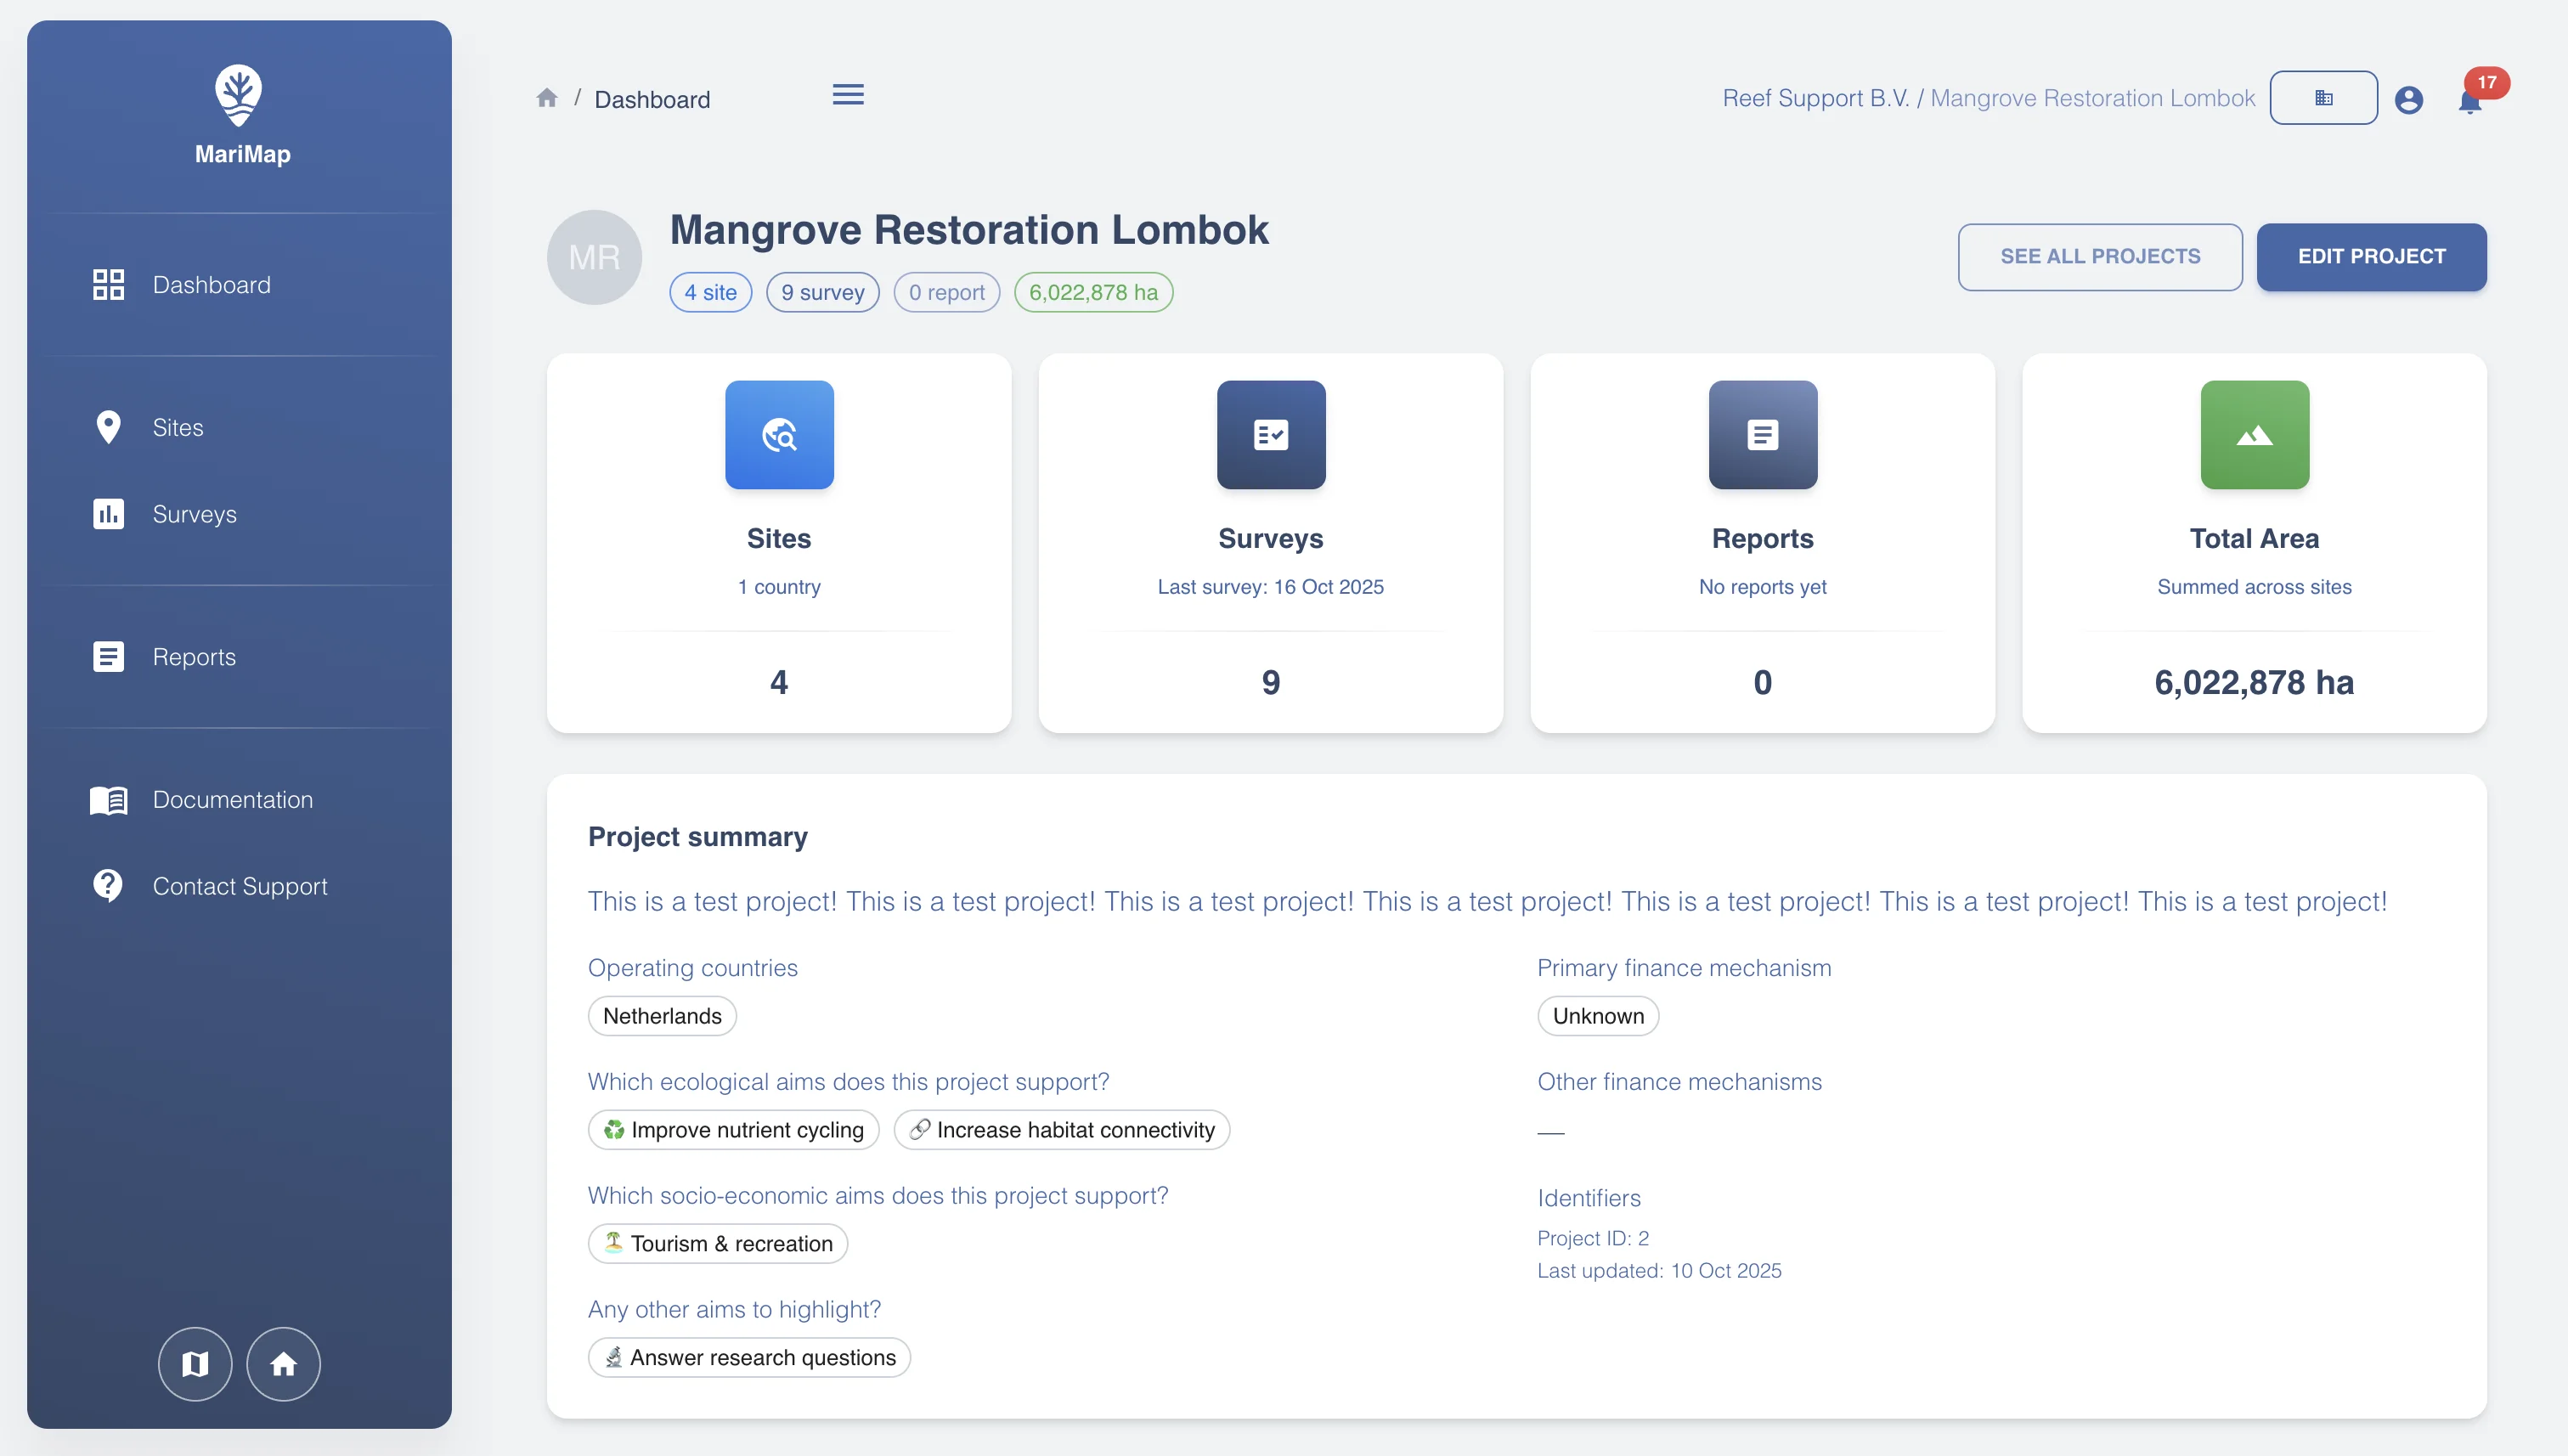
Track thousands of coral fragments across multiple nursery structures. Each fragment carries a unique identifier linked to its donor colony, genotype, species, attachment date, and nursery location. Bulk operations let you register batches of fragments during propagation events. Scheduled health assessments flag mortality, disease, or predation early so you can intervene before losing material. Fragment transfer records maintain chain-of-custody when material moves between nurseries or to outplant sites.
Survival analysis and reporting
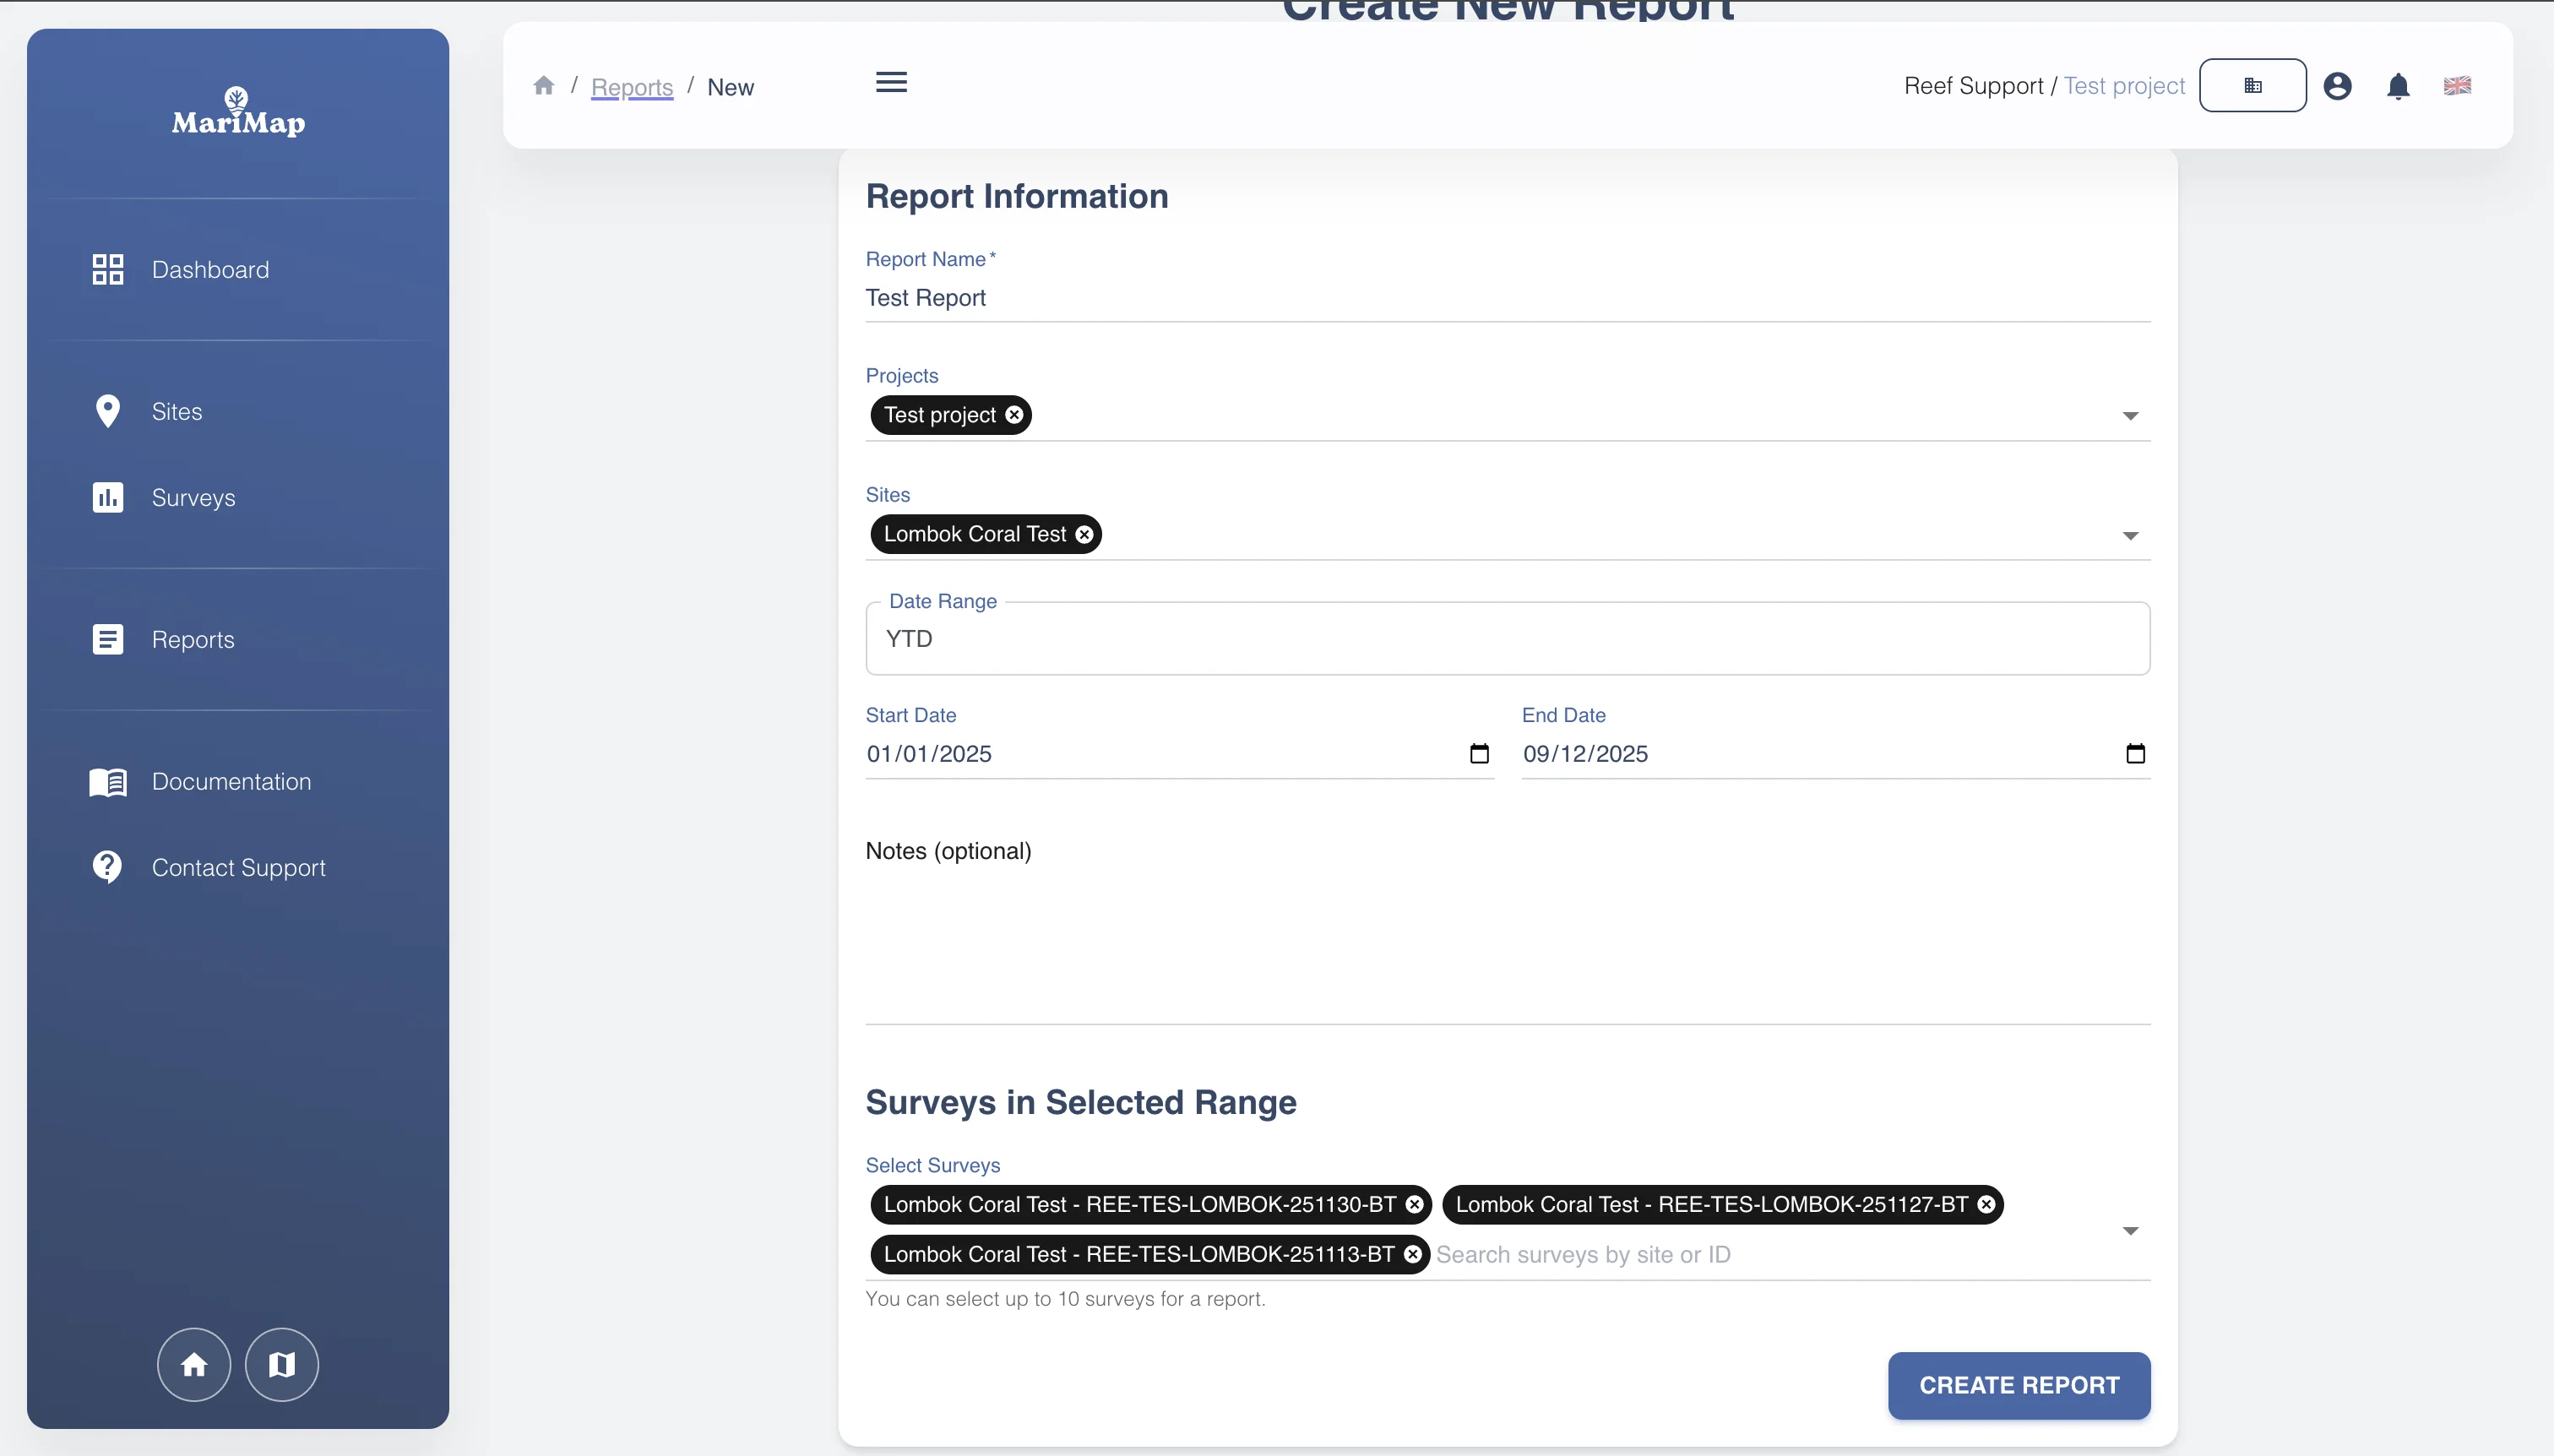
Kaplan-Meier survival curves calculate automatically from monitoring data, properly handling censored observations when fragments are lost or cannot be relocated. Compare survival rates across species, genotypes, nursery methods, outplant sites, or seasonal cohorts. Time-to-event analysis identifies critical mortality periods. Export publication-ready charts and data tables for funder reports, scientific publications, and adaptive management reviews.
Cost tracking and efficiency
Attach cost data to restoration activities including propagation, nursery maintenance, outplanting operations, and monitoring visits. Calculate cost-per-fragment, cost-per-surviving-colony, and cost-per-square-meter of restored reef. Compare efficiency across methods, sites, and seasons to optimize resource allocation. Financial summaries align with funder reporting requirements and support budget planning for program expansion.
Why restoration tracking matters
Adaptive management
Quantitative survival and growth data enables evidence-based decisions about which species, genotypes, and methods perform best at each site. Programs that track outcomes systematically can adjust their approach between cohorts rather than waiting years for results.
Funder accountability
Structured data with full audit trails satisfies reporting requirements for GCF, GEF, bilateral donors, and private funders. Automated report generation reduces the time between field work and deliverable submission from weeks to hours.

Scientific contribution
Standardized restoration data contributes to the growing body of evidence on coral restoration effectiveness. Comparable datasets across programs and geographies help the field identify best practices and advance restoration science.
Ready to put MariMap to work?
Talk to our team about your monitoring programme, or start exploring the platform right away.