
Platform
From raw survey data to clear conservation insights
MariMap turns field observations into biodiversity indices, trend charts, data quality scores, and structured reports. Analyze results across sites, seasons, and years to track progress and communicate outcomes.
Statistical rigour
See how strong the evidence is, not just the trend.
MariMap runs Mann-Kendall trend tests and Sen's slope estimation on your monitoring indicators. Every chart can show the underlying p-value, effect size (tau), Sen's slope, and 95% confidence interval. You can see exactly how strong the evidence is for a reported trend.
There is strong evidence that live coral cover is decreasing.
Your monitoring has a 78% chance of detecting real changes of this size.
Analytics
Analytics capabilities

Biodiversity indices
Shannon diversity, Simpson index, species richness, and evenness. MariMap calculates these automatically from survey data and provides confidence intervals so you can assess the reliability of every result.

Trend analysis
Trend analysis applied to your monitoring indicators. See whether coral cover, fish biomass, or water quality parameters are improving, declining, or stable over time.

Health indicators
A composite Health Performance Index combines multiple ecological metrics into a single site-level score. Track how site health evolves across monitoring periods and compare performance between locations.

Data quality scoring
Automated checks evaluate survey completeness, species identification confidence, spatial accuracy, and temporal consistency. Every dataset receives a quality score so you can identify gaps before they reach reports.

Interactive charts and visualizations
Bar charts, line charts, scatter plots, heatmaps, spatial maps, and more. Every chart is interactive, supports filtering by date range or site, and can be exported as an image or included in reports.

Statistical rigour
Mann-Kendall trend tests and Sen’s slope estimation validate every reported trend. Each result includes a p-value, effect size, Sen’s slope, and 95 % confidence interval so you can distinguish real change from noise before sharing findings with funders or verifiers.
Reporting
Report builder
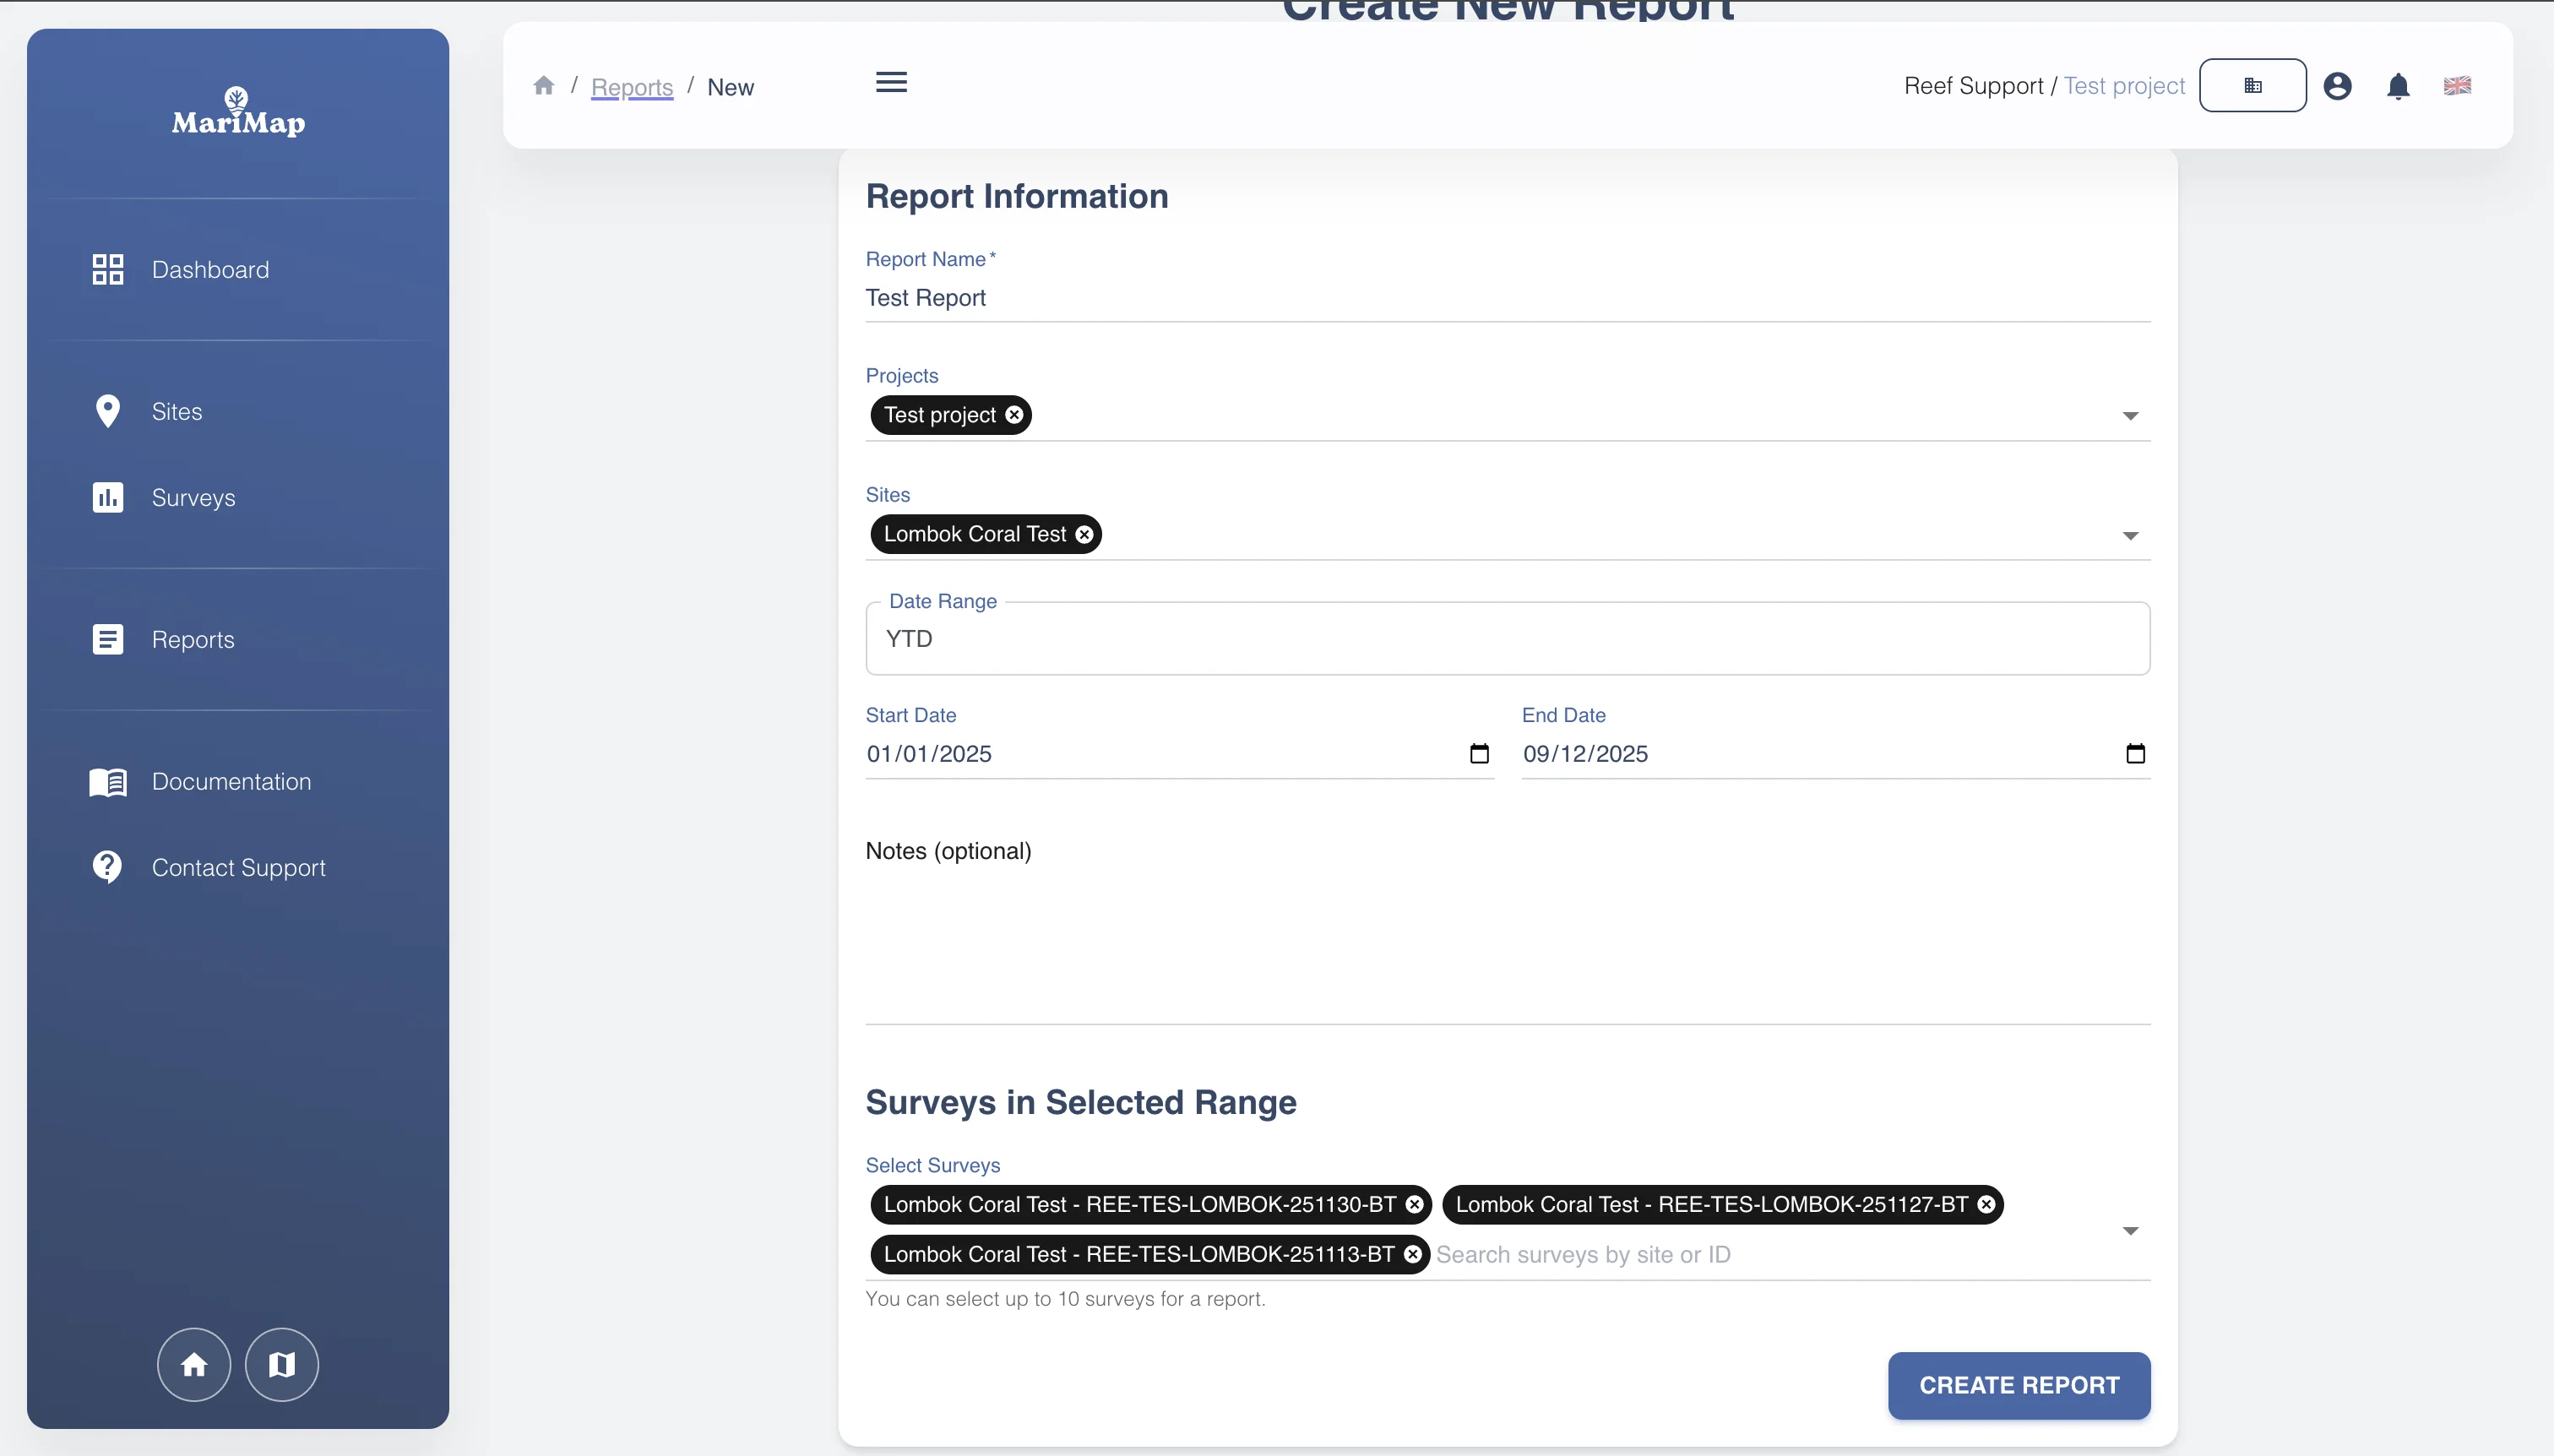
Build reports by selecting surveys, date ranges, and output sections. MariMap compiles your data into structured documents with charts, summary tables, and narrative sections that describe what the numbers mean for conservation outcomes.
Interoperability
Export formats
MariMap supports 5 export formats designed for interoperability with global biodiversity databases and reporting frameworks.
- Darwin Core Archive (for OBIS/GBIF submission)
- GCRMN (Global Coral Reef Monitoring Network format)
- GeoJSON (for GIS integration)
- CSV/spreadsheet (for data analysis)
- PDF (for stakeholder and funder reports)
Overview
Dashboard
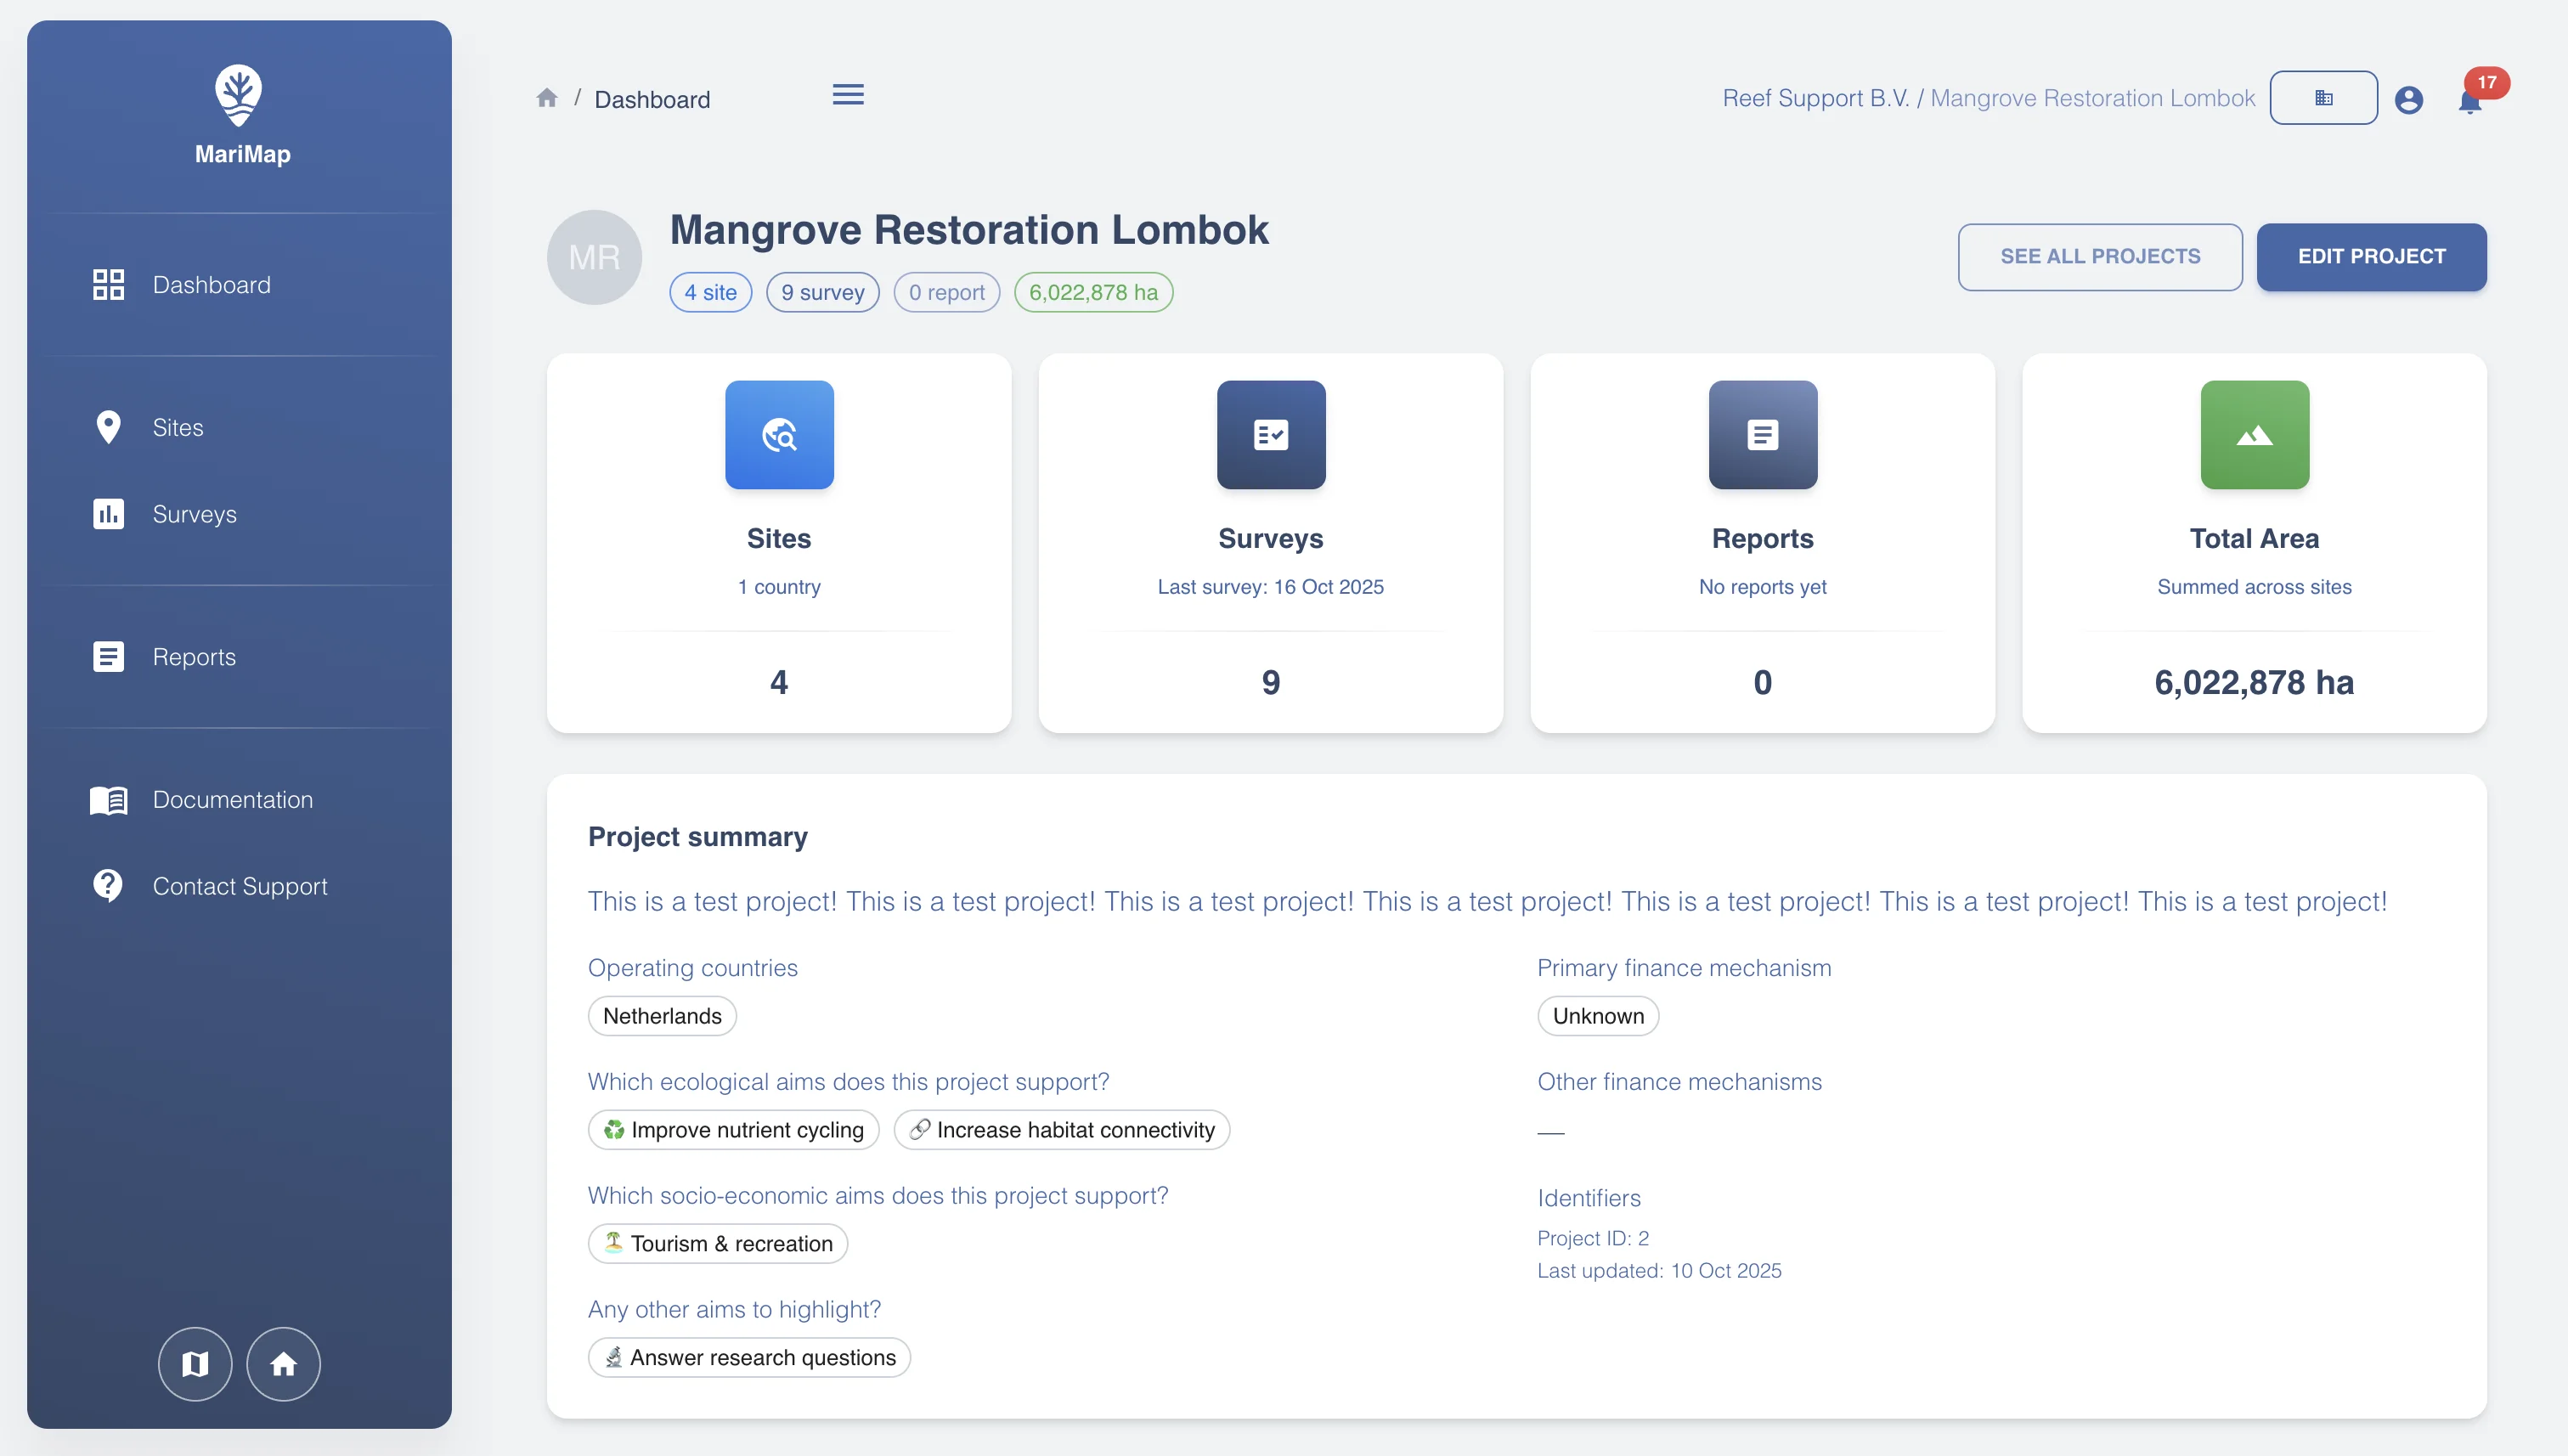
The MariMap dashboard gives you a snapshot of your monitoring program at a glance. See active sites, recent survey activity, key biodiversity indicators, and alerts that require attention, all in one place.
Ready to put MariMap to work?
Talk to our team about your monitoring programme, or start exploring the platform right away.